Get Free resources, winning decks & much more!
Everything you need to get better at case competitions, from past winning decks to proven frameworks - all in one place.
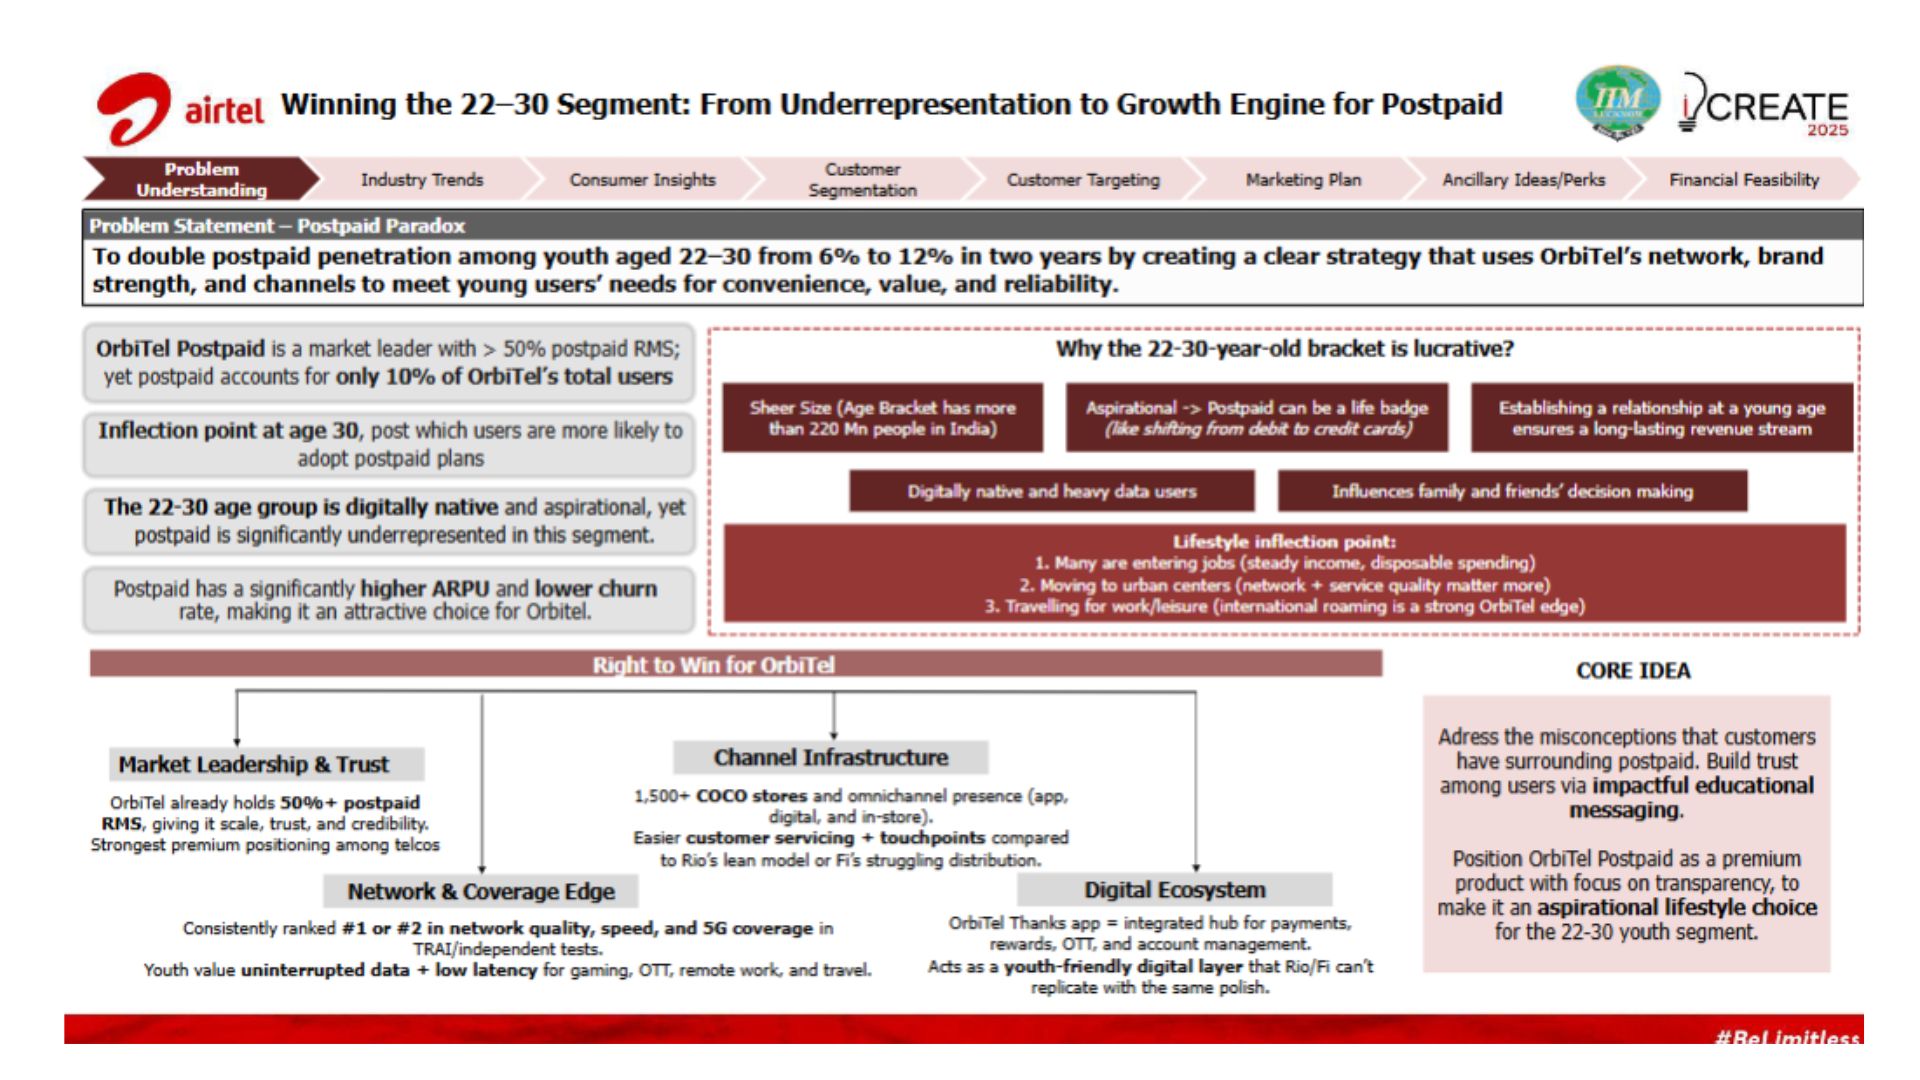
Real, winning decks from case competitions across India - sign in once, unlock all of it.
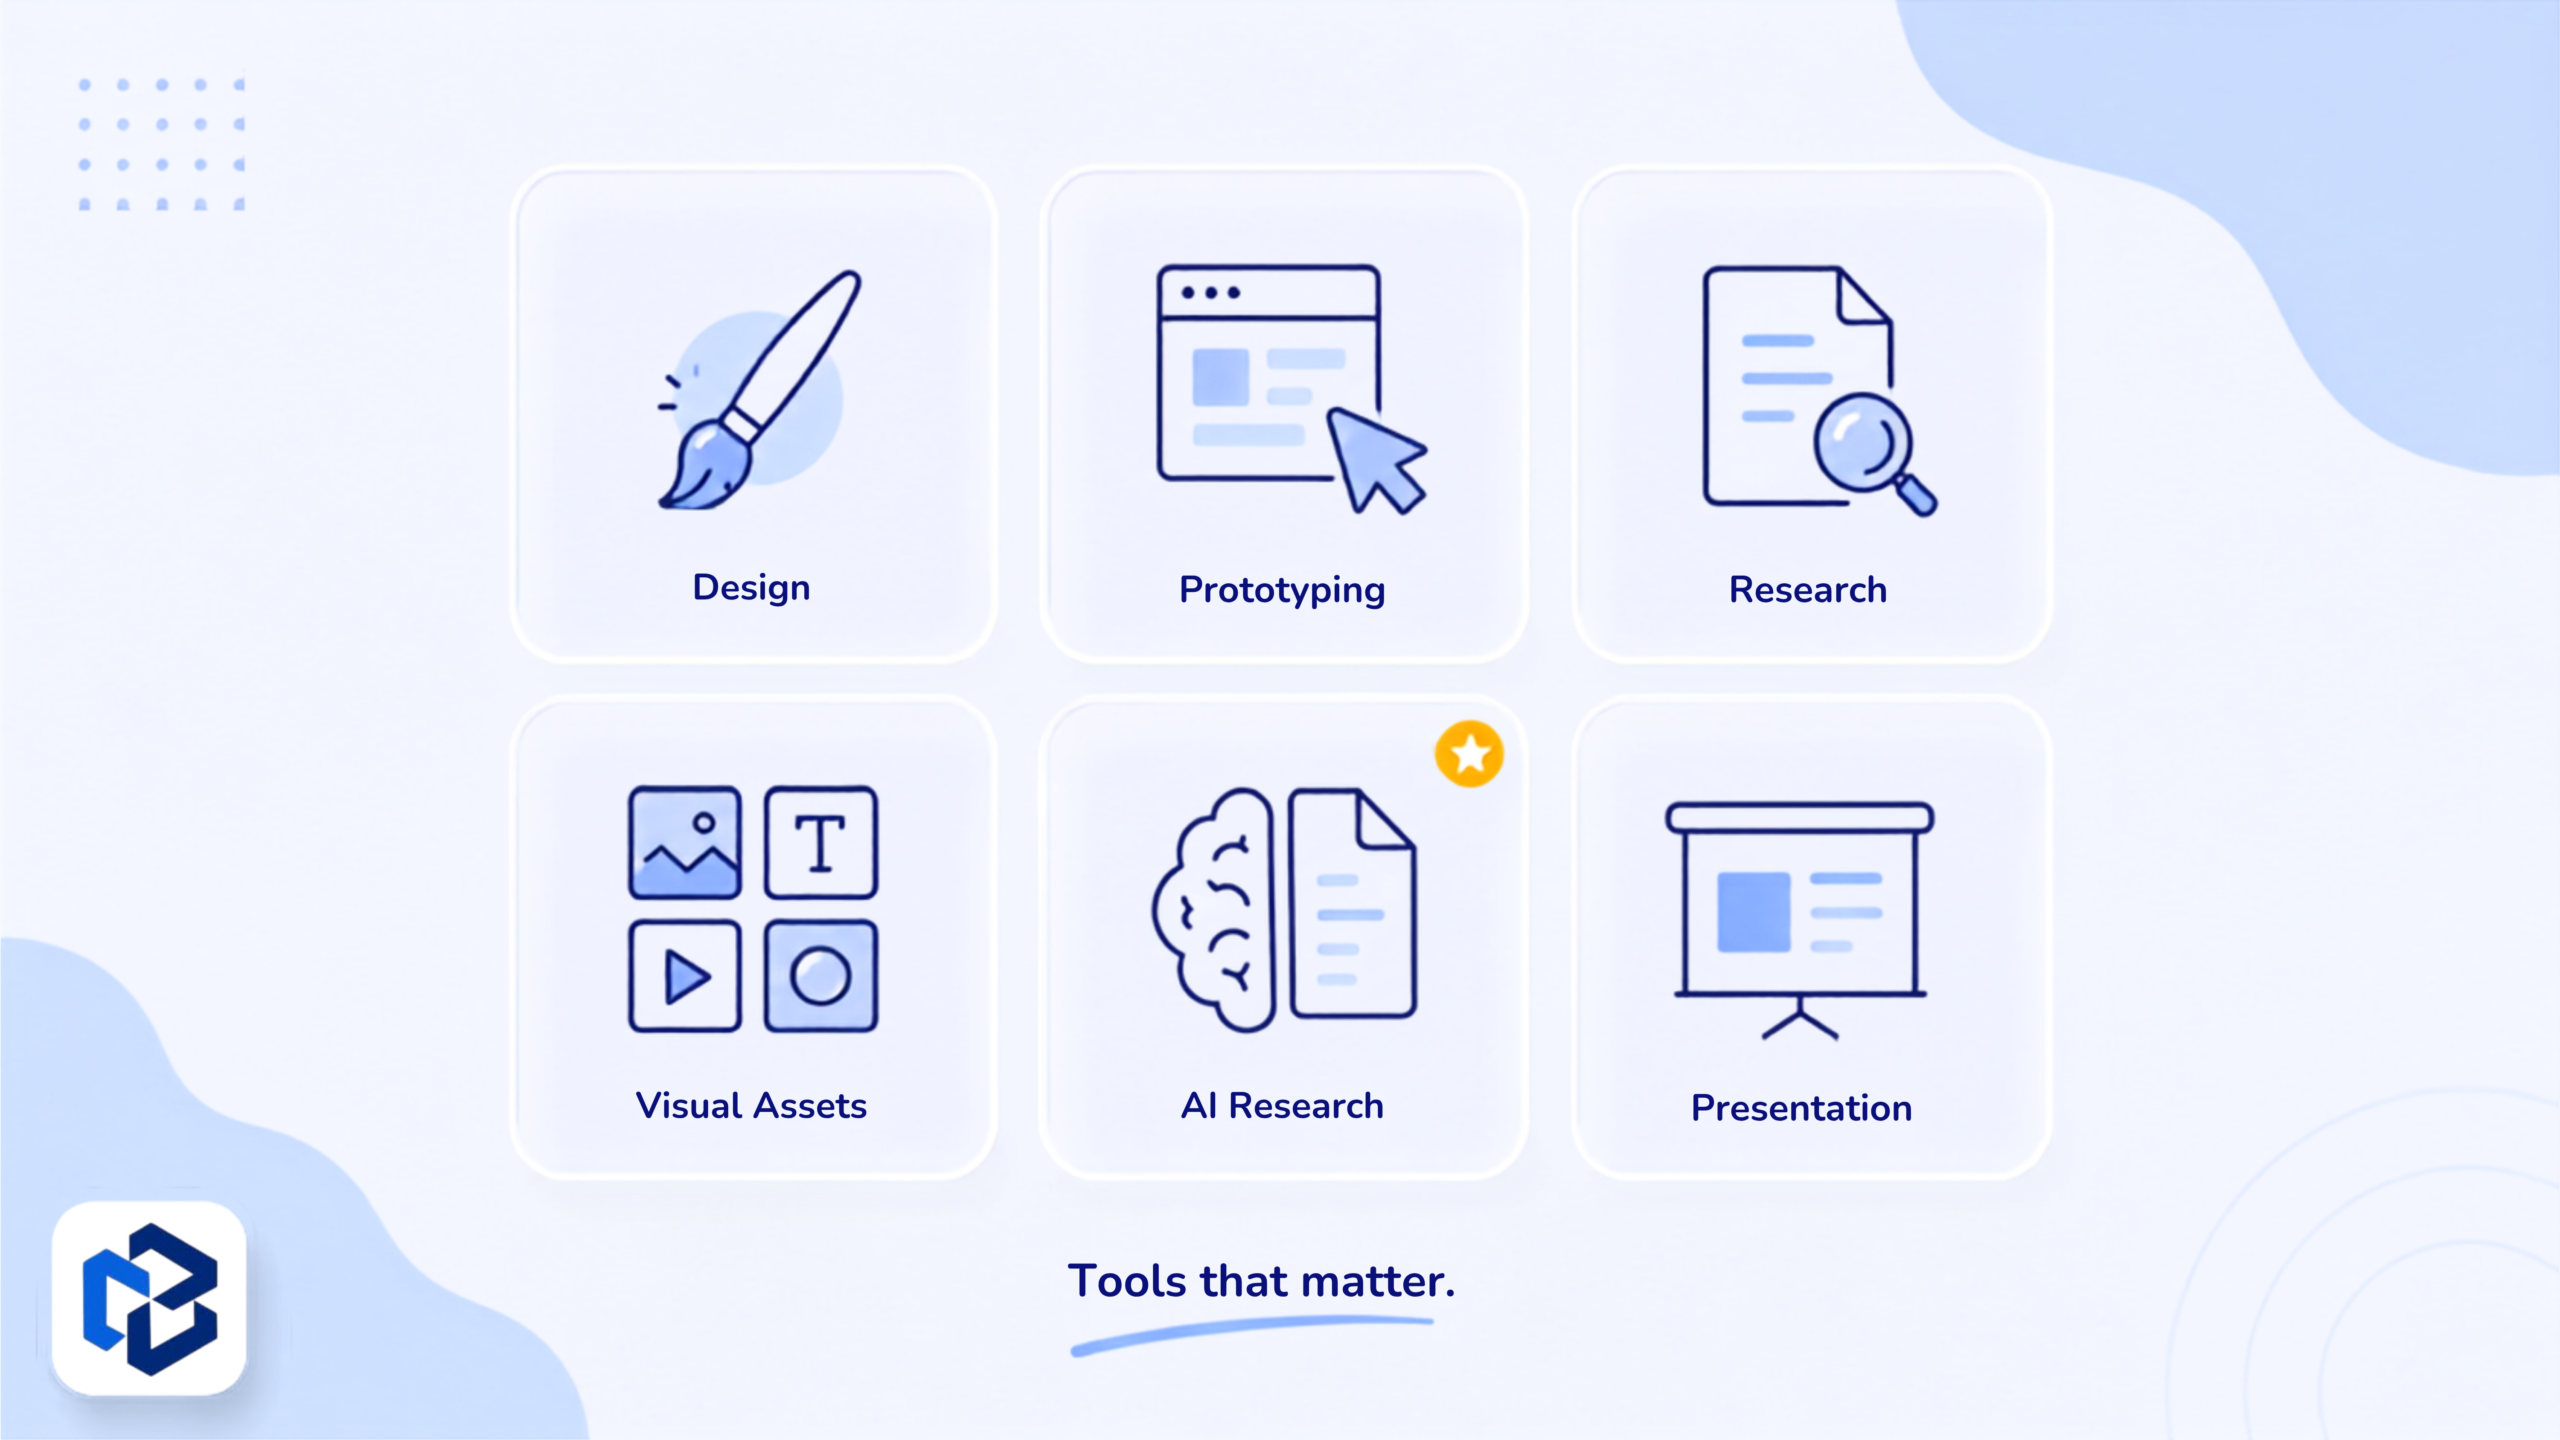
Browse decks →A structured compendium of analytical tools, organised by domain, ready whenever a case calls for it.
View frameworks →Every live and upcoming case competition, tracked in one place, so you never miss a deadline.
See the calendar →


A structured compendium of analytical tools organised by domain, ready whenever a case calls for it.
The CaseBuzz Course walks you through case prep from the ground up - proven hacks, structured frameworks, and the exact approach that wins, at your own pace.


CaseBuzz started during our own case competition days, when finding good decks, simple frameworks, and decent prep material felt unnecessarily hard.
We're building it as the space we wished existed.

A course on proven hacks, guides and everything to make you case competition ready.
Enroll now →